The Real-time tab in the web client provides navigation to SAMs, access to monitoring views, and action buttons to perform tasks.
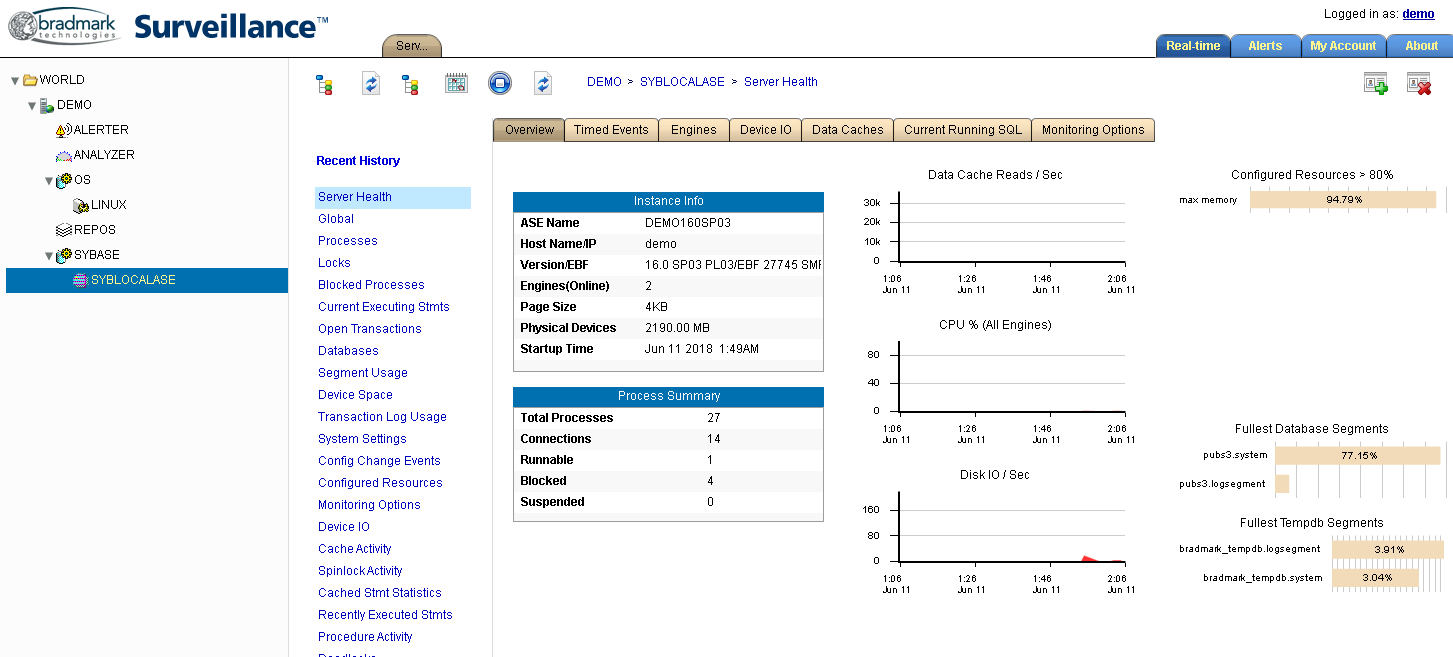
This is an example of the Real-time tab. Most databases have a "Health" window to provide an overall view of availability and performance. The screen is updated automatically every 30 seconds or so. Various items can be clicked on, and graphs can be scrolled and zoomed.
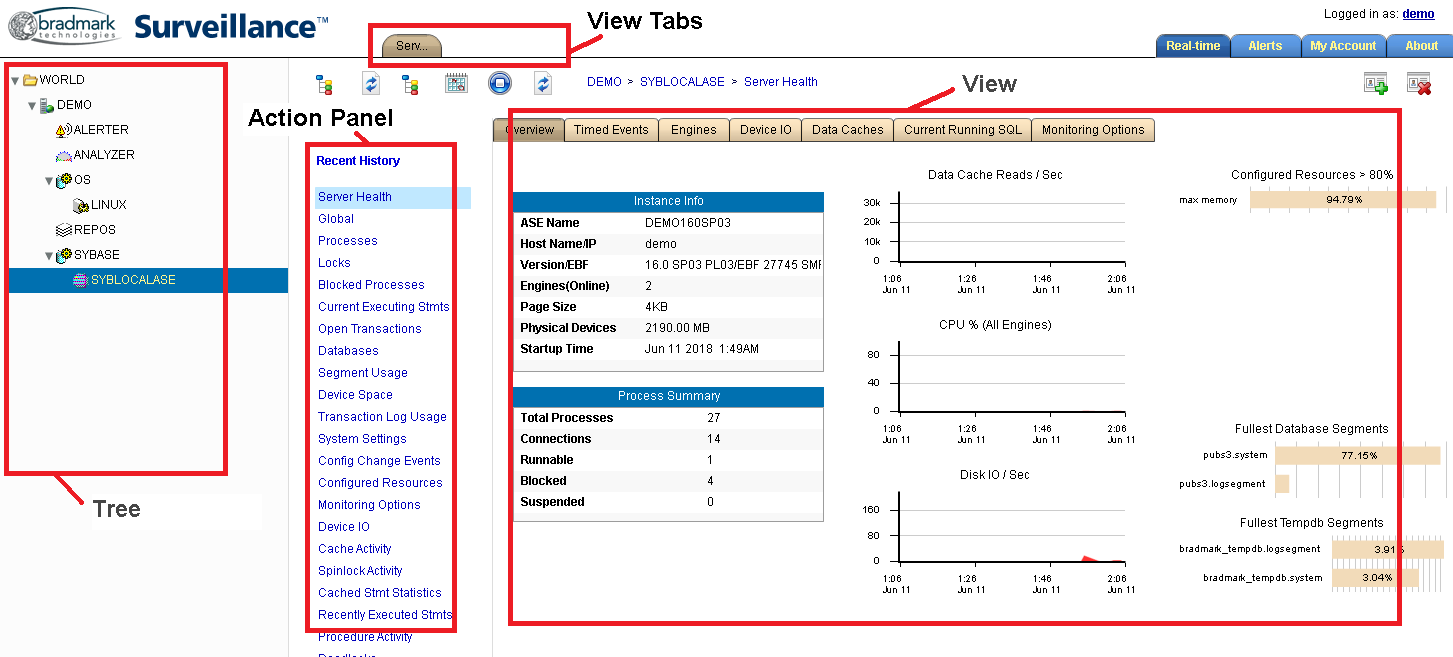
The Real-time tab contains several parts--as shown in Figure 2--including the Tree, Action Panel, View, and View Tabs. The Real-time tab toolbar is just above the Action Panel, and the breadcrumbs are just above the View.
Real-time Tab Toolbar
The Real-time tab toolbar provides buttons for hiding / unhiding parts of the screen, refreshing data, pausing refreshes, and jumping to other points-in-time.
| Icon | Action |
|---|---|
|
|
Hides or unhides the tree of SAMs on the left side of the screen. |
|
|
Refreshes the tree of SAMs on the left side of the screen. |
|
|
Hides or unhides the action panel in the middle of the screen. |
|
|
Jumps (via flashback) to the point-in-time specified. A popup allows you to specify the date and time to jump to. A new flashback toolbar appears, while in flashback mode, to allow you to move backward and forward in certain time increments. |
|
|
Pauses / resumes automatic refresh of opened views. The icon changes to reflect the current state (paused or resumed). |
|
|
Refreshes the opened views, in all view tabs, without waiting for the automatic refresh. This is known as a manual refresh. |
Breadcrumbs
The breadcrumbs, shown just above the View area, provide the context of the opened view. It shows the SAM, the entity or agent name, and the view name. The breadcrumbs change as you open different views, or as you move between view tabs.