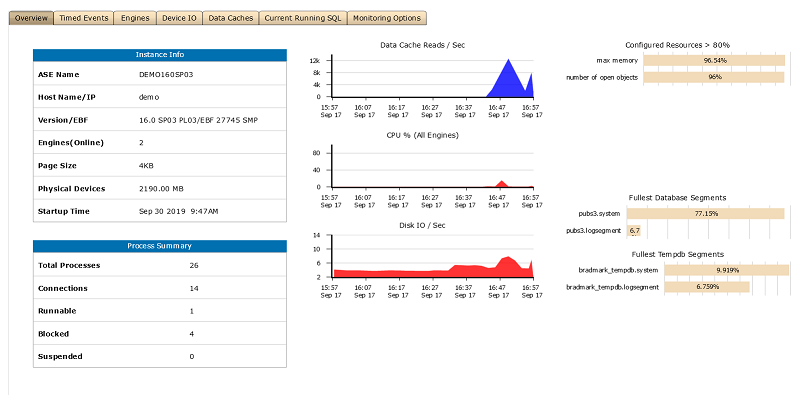
Overall health of the database instance
Instance Info - Columns
| Name |
Description |
| (First Column) |
Metric name |
| (Second Column) |
Metric value |
Process Summary - Columns
| Name |
Description |
| (First Column) |
Metric name |
| (Second Column) |
Metric value |
Current Event Time - Top Timed Events - Columns
| Name |
Description |
| ID |
Event ID |
| Description |
Event description |
| Count |
Delta number of events |
| Time |
Event time delta |
| % |
% of total event time over all events, in interval |
Overall Event Time - Top Timed Events - Columns
| Name |
Description |
| ID |
Event ID |
| Description |
Event description |
| Count |
Total number of events, since collection started |
| Time |
Total event time, since collection started |
| % |
% of total event time, since collection started |
Engines - Columns
| Name |
Description |
| Inst ID |
Instance ID; 0 = non-CE |
| Eng # |
Engine ID |
| Status |
Status of the engine (online, offline, etc.) |
| CPU Utilization |
System CPU %, in interval +
User CPU %, in interval |
| Context Switches / Sec |
Number of context switches per second, in interval |
| Cur Sys CPU |
Delta System CPU time of engine |
| Cur Sys % |
System CPU %, in interval |
| Cur User CPU |
Delta User CPU time of engine |
| Cur User % |
User CPU %, in interval |
| Cur Idle CPU |
Delta Idle CPU time of engine |
| Cur Idle % |
Idle CPU %, in interval |
| Ovr Switches / Sec |
Average number of context switches per second, since collection started |
| Process Affinitied |
Number of processes affinitied to the engine |
| Affinitied CPU # |
ID of CPU to which the engine is affinitied to |
| Ovr Sys CPU |
Total System CPU time of engine, since collection started |
| Ovr Sys % |
Average System CPU %, since collection started |
| Ovr User CPU |
Total User CPU time of engine, since collection started |
| Ovr User % |
Average User CPU %, since collection started |
| Ovr Idle CPU |
Total Idle CPU time of engine, since collection started |
| Ovr Idle % |
Average Idle CPU %, since collection started |
Device IO - Columns
| Name |
Description |
| Inst ID |
Instance ID; 0 = non-CE |
| Name |
Logical name for the device |
| Physical IOs / Sec |
Number of reads per second, in interval +
Number of writes per second, in interval +
Number of asynchronous prefetch (APF) reads per second, in interval |
| IO Time |
Duration time per I/O operation in interval |
| Avg IO Time |
Average duration time per I/O operation in interval |
| % Total IO |
% of total number of I/O operations per second, in interval, over all devices |
| Avg IOs / Sec |
Average number of I/O operations per second, since collection started |
| Semaphore Waits |
Total number of waits for sync on I/O operation to mirrored device, if applicable, since collection started |
| Reads / Sec |
Number of reads per second, in interval |
| Writes / Sec |
Number of writes per second, in interval |
| APF Reads / Sec |
Number of asynchronous prefetch (APF) reads per second, in interval |
| Ovr Reads |
Total number of reads, since collection started |
| Ovr Writes |
Total number of writes, since collection started |
| Ovr APF Reads |
Total number of asynchronous prefetch (APF) reads, since collection started |
| Device Type |
Type of device (Default Disk, Physical Disk, Dump Device) |
| Physical Name |
Full file path for the device |
Data Caches - Columns
| Name |
Description |
| Inst ID |
Instance ID; 0 = non-CE |
| Name |
Data cache name |
| Logical Reads / Sec |
Number of logical reads per second, in interval |
| Current Logical Reads |
Delta number of logical reads |
| Miss % |
Data cache miss %, or how often logical reads required physical reads |
| Ovr Logical Reads |
Total number of logical reads, since collection started |
Current Running SQL - Columns
| Name |
Description |
| Inst ID |
Instance ID; 0 = non-CE |
| SPID |
Session process ID |
| Login |
User login name |
| Elapsed Time |
Elapsed time |
| SQL Text |
SQL text preview |
| Start Time |
Start time of statement |
| Line # |
Line number in the batch |
| CPU Time |
CPU time |
| Wait Time |
Wait time |
| Database |
Database name |
| Memory |
Memory usage |
| Physical Reads |
Number of physical reads |
| Logical Reads |
Number of logical reads |
| Packets Sent |
Number of network packets sent |
| Bytes Sent |
Network bytes sent |
| Packets Received |
Number of network packets received |
| Bytes Received |
Network bytes received |
| Procedure |
Procedure name, if applicable |
| Batch ID |
Batch ID |
| KPID |
Kernel process ID |
Monitoring Options - MDA Options - Columns
| Name |
Description |
| Name |
Name of the monitoring option |
| Enabled |
If the monitoring option is enabled, then: Enabled |
| Disabled |
If the monitoring option is disabled, then: Disabled |
Monitoring Options - MDA Pipe Options and Sizes - Columns
| Name |
Description |
| Name |
Name of the pipe monitoring option |
| Enabled |
If the monitoring option is enabled, then: Enabled |
| Disabled |
If the monitoring option is disabled, then: Disabled |
| Size |
Size for the pipe |
Entity Requirements
| Attributes: |
MDA (and no CE or CEINST) |
| Minimum database version: |
12.5.0.3 |